In science, just like with everything, it’s important to look at the full picture.
If some information is missing or taken out of context, you might not reach the correct conclusion. By only showing or omitting certain information or data, misinformers push you toward conclusions that fit their narrative.
With the COP27 happening right now, we thought it would be appropriate to show you how disinformers have been using this tactic to deny climate change
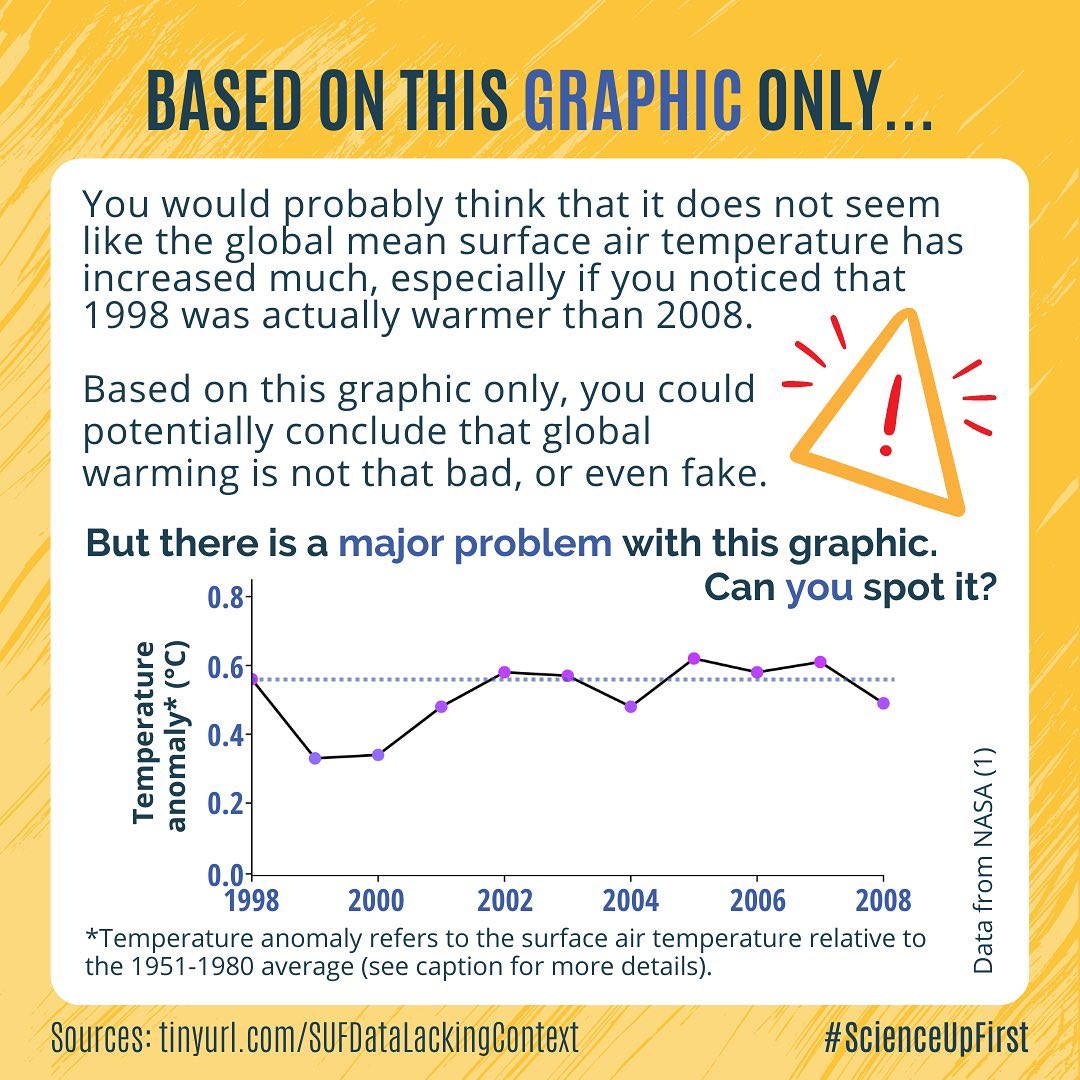
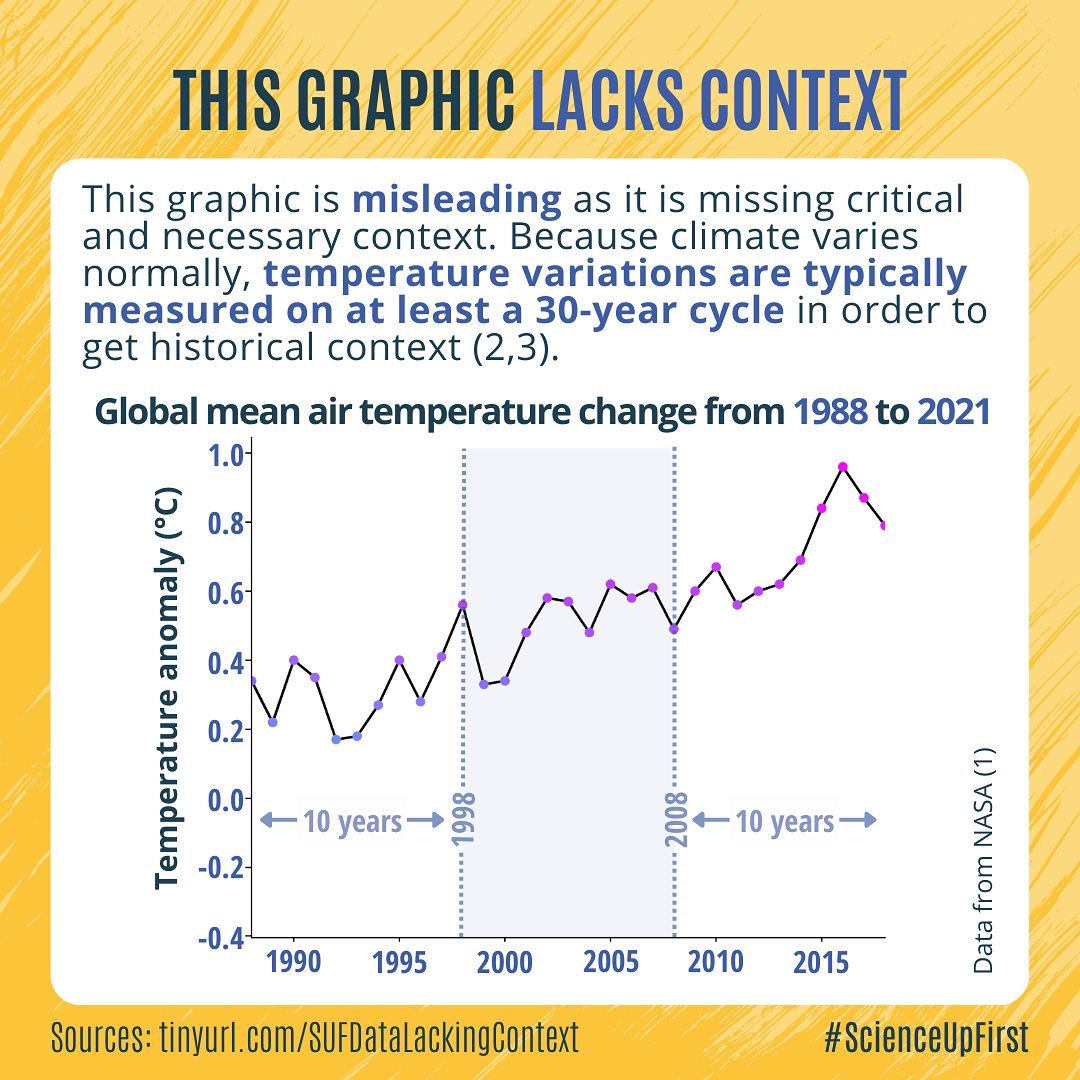
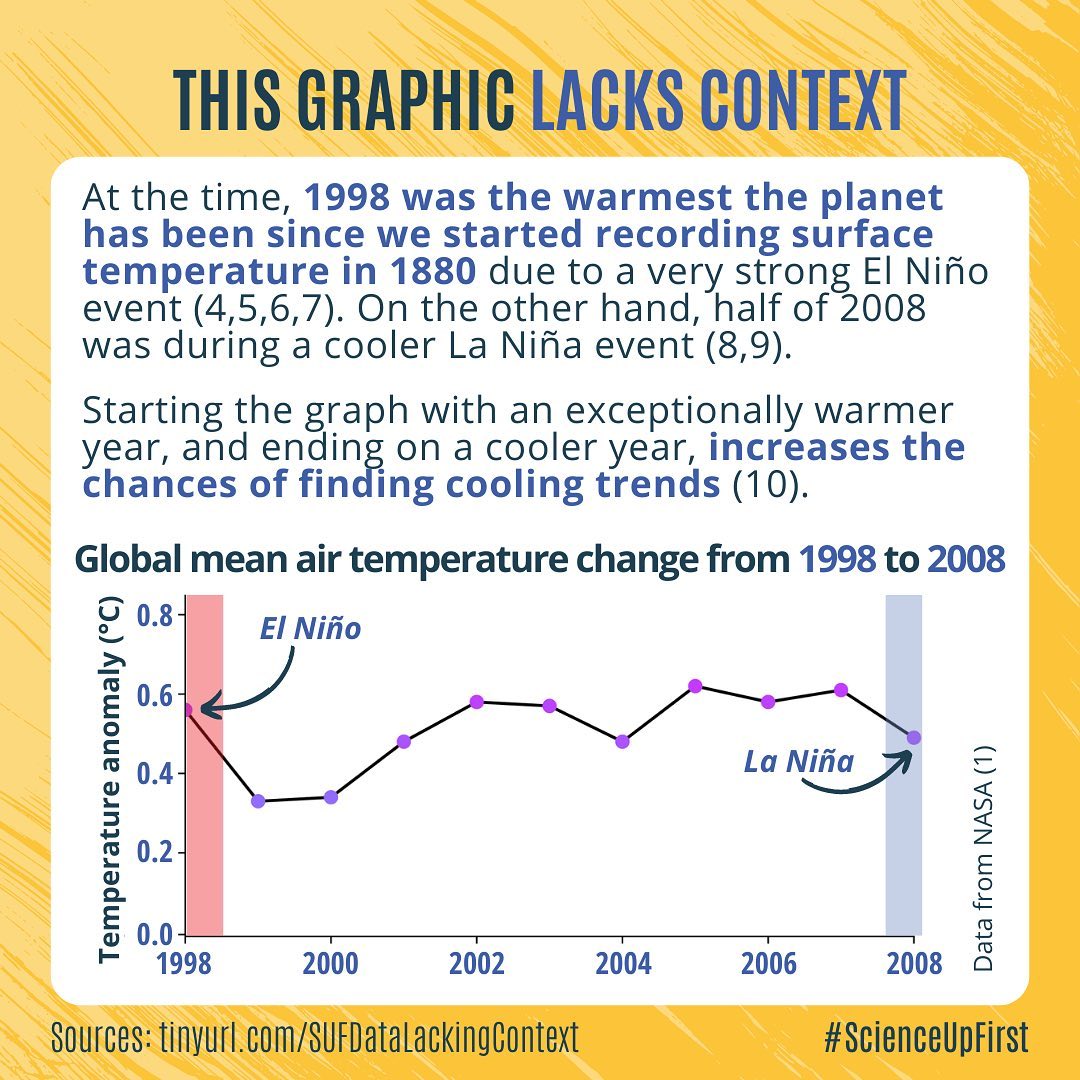
Disinformers will include only a narrow range of data, neglecting the fact that climate data needs to be interpreted in a minimum cycle of 30 years. The next trick they use is to start the graph with an exceptionally warm year (without telling you so, of course!) and end with a colder one. This would result in a graph showing, what it looks like, a decrease in global surface temperature.
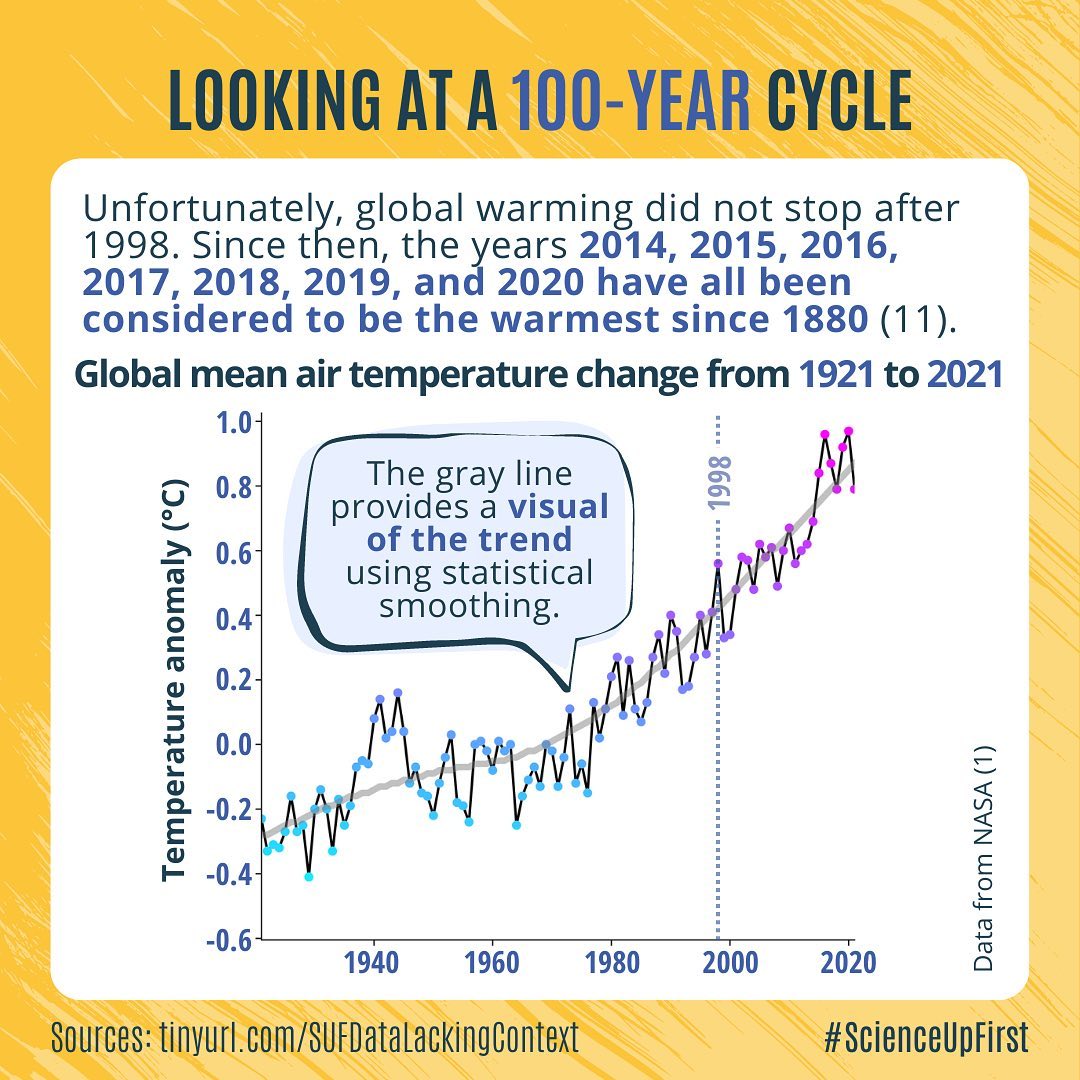
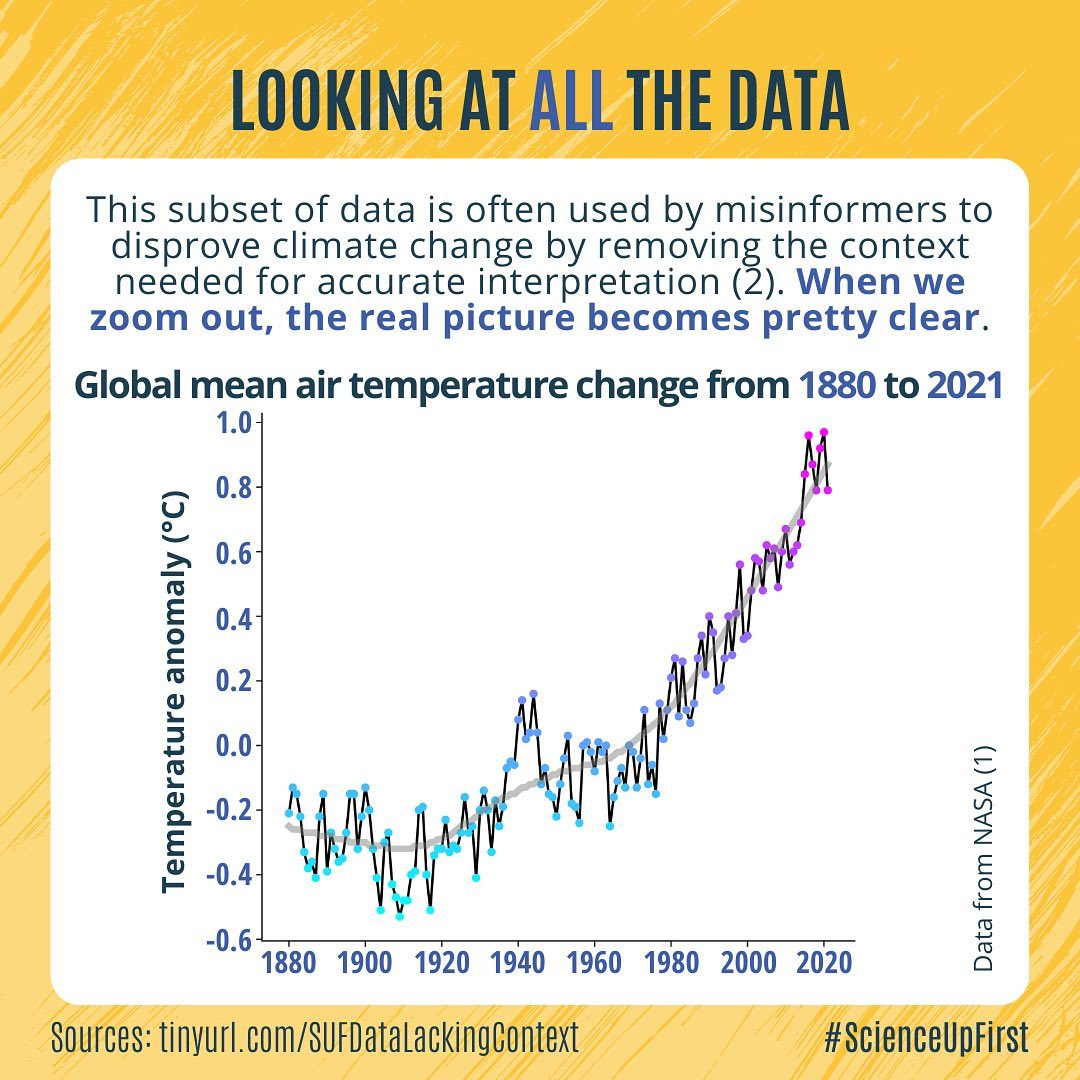
Global mean surface air temperature data are just like pixels in a picture: the more pixels you have the better the picture is. Similarly, the more data are included the clearer the trend will be. LOWESS (locally weighted scatter plot smooth) regression line is used to show a trend more clearly with data that have a lot of noise or natural variation like climate data (12,13). This regression line (grey line) is only shown in the last two graphics, given the need for sufficient sample size to estimate local regression (14). In this example, the trend shows a clear global surface air temperature increase since 1880.
A big thank you to Dr. Sarah Treit at @figures.first for collaborating with us on this post! Stay tuned as we unravel together more ways data can be misrepresented!
Remember, when looking at data, make sure that you have the full picture.
*Temperature anomaly refers to the difference in temperature from that year relative to the average temperature from 1951 to 1980, as defined by NASA(15,16).
Share our original Tweet!
In science, just like with everything, it’s important to look at the full picture.
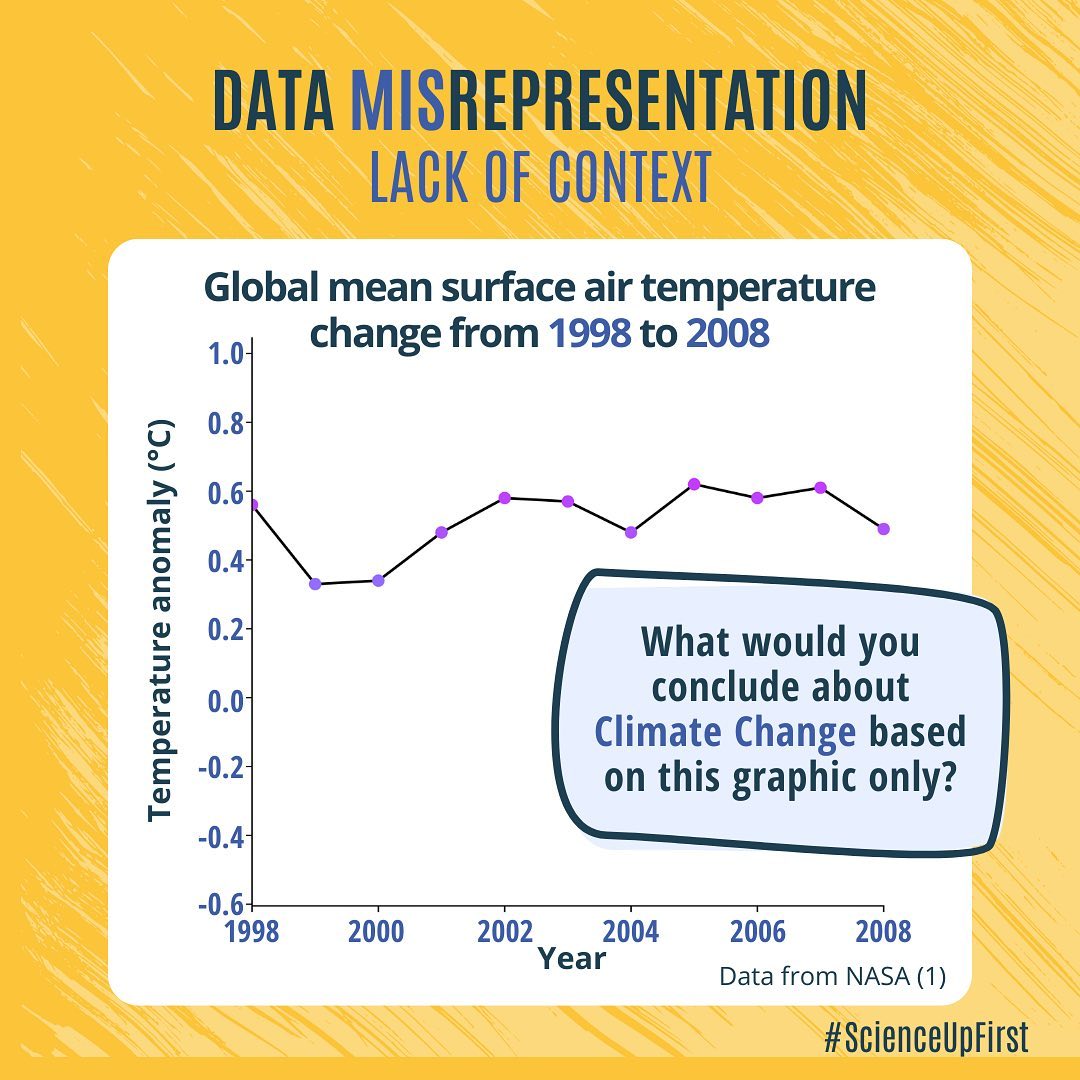
What would you conclude about Climate Change based on this graphic only?#ScienceUpFirst
[1/6] pic.twitter.com/KNGN3kOQop
— ScienceUpFirst | LaScienced’Abord (@ScienceUpFirst) November 17, 2022
View our original Instagram Post!
View this post on Instagram
- GISS Surface Temperature Analysis (v4): Analysis Graphs and Plots
- Misleading Statistics – Real World Examples For Misuse of Data
- New Two-Tier approach on “climate normals”
- September 1998 Global Climate Report
- Earth Temperature in 1998 Is Reported at Record High
- When scientists say the Earth has warmed by 1° Celsius, which parts of the planet are being measured?
- El Niño – 1998 Global Surface Temperature: Highest by a Wide Margin – Bangladesh
- Annual 2008 El Niño/Southern Oscillation
- La Nina Still Going in January 2008
- What is the El Niño–Southern Oscillation (ENSO) in a nutshell?
- Climate Prediction Center
- LOESS. Smoothing data using local regression
- Lowess Smoothing – MATLAB & Simulink
- Locally Weighted Regression: An Approach to Regression Analysis by Local Fitting
- Weather Forecast Office – Frequently Asked Questions
- Global Surface Temperature Change